Introduction

The pension fund value chain is overly complex, costly and completely opaque to the end consumer. The Kay Review of UK Equity Markets and Long-term Decision-making (2013) highlighted this. In fact, the total cost of owning (TCO) a pension fund is not only unknown to the consumer, it has not been, and cannot be, calculated by any other stakeholder (Industry or Regulator) at this time. In reality, only the annual management charge (AMC) or total expense ratio (TER) are typically calculated and declared and these may be as little as half of the real TCO, as the costs of trading and the ‘covert costs’ (resulting from either conflicts of interest and/or vertical integration) are not captured or included.
Knowing the TCO is important because:
– There is no purchasing decision we should make without knowing costs
– Cost and performance are two sides of the same coin, as performance is reported net of costs. Reduce the cost and you increase the performance.
– Reducing costs by 1%, and improving performance by that 1%, will result in a long-term increase of 25% in the total value of a pension.
– Where costs are not transparent, the information asymmetry leads to questionable behaviour. An example is the covert nature of FX pricing applied by Custody Banks to pension fund assets, currently under US SEC investigation.
Recently the industry stance of ‘costs aren’t material to the decision-making process’ has changed as the matter has come under public scrutiny (e.g. “Better workplace pensions: a consultation on charging” by the DWP), and the IMA released a SORP in mid 2013 for collecting costs, but only for Retail Funds.
What do we know at this time?
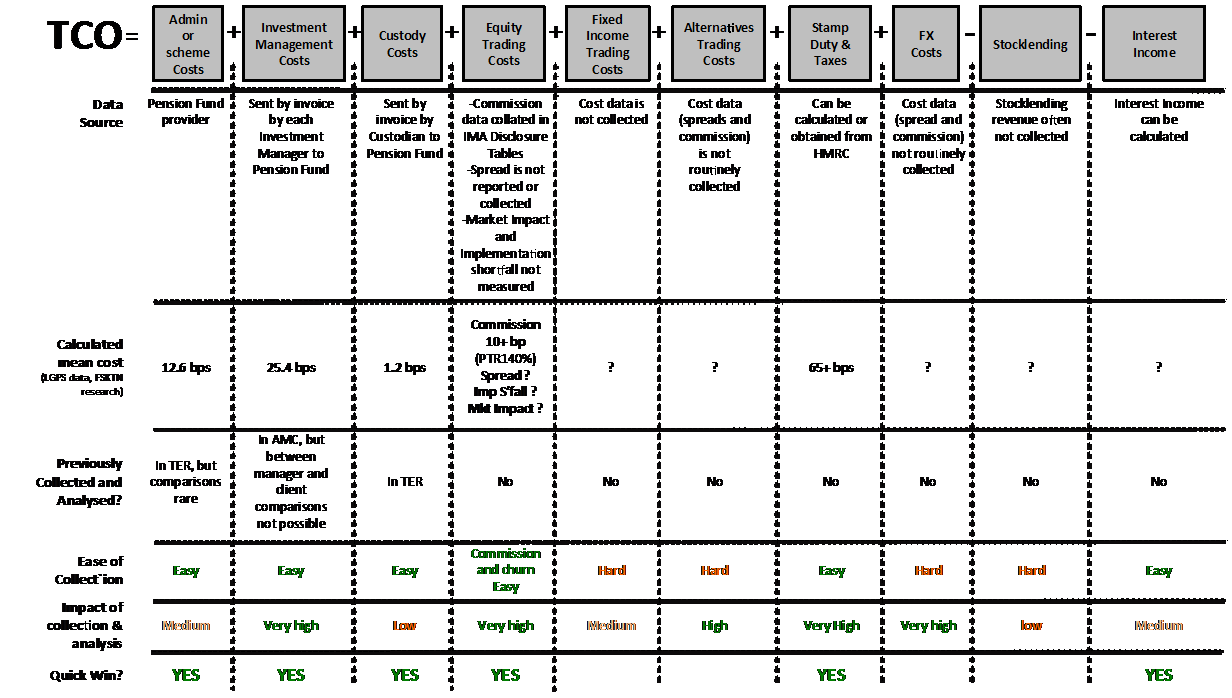
Cost and fee data is routinely collected in a number of areas but is not necessarily collated in a useful way. Whilst it is possible to find figures for AMC and TER, these reveal only a fraction of the total costs (Fig 1). Empirical research by the Financial Services KTN reveals that costs (equivalent to just a portion of the TCO) composed of AMC, TER, equity trading commission and tax, comes to 1.1%. Beyond this empirical data, there is burgeoning consensus that the real TCO approaches 3% of AUM per annum, a figure well beyond the received wisdom that pension funds are cheap to produce and manage. It also means that an additional 1.9% of costs have not been clearly quantified.
However, granular data is useful in many other ways than just building a picture of the total industry draw-down on pension fund assets (i.e. the TCO). Comparing fee schedules across clients for single asset managers is another useful application, particularly as anecdotal evidence (through interviews with Corporate Advisors, Trustees and a high-level examination of the data) reveals differing AMCs, trading patterns and equity commission charging between different clients of asset managers using identical fund strategies. This is alarming and highlights the need for transparency and independently generated comparative data across the industry.
What are the quick wins?
Quick wins include whole scale collection and analysis of any data that is routinely collected but not currently analysed or presented, as follows with the ‘quick win’ data source in red:
– Investment consultant recommendations matched to subsequent costs and performance of those recommendations – Consultant data collected by pension funds
– A comprehensive database of granular and comparative AMCs by asset manager, matched to performance – AMCs are invoiced to pension funds by asset managers
– Benchmarks for AMC by strategy – Data captured by Pension Funds
– A comprehensive database of comparative scheme administration costs – Data collected by pension funds
– A comprehensive database of custody costs – Invoiced to pension funds by custodians
– Pension fund equity trading commission data segmented by pension fund, asset manager and broker – Collected by asset managers and submitted to pension funds in IMA disclosure tables
Key stakeholders have agreed that all of these quick wins are significant.
What are the longer-term objectives?
- Creating a database that will allow independent analysis of cost and performance data using the UK science base
- Establishing benchmarks to allow better decision making
- Develop new consumer interfaces using innovators from the digital and mobile sectors in combination with emergent visualization techniques to improve consumer engagement.
- Greater transparency to allow better decision-making and the elimination of conflicts of interest in the value chain
- Innovation in technology to reduce cost, complexity and risk. This is particularly significant as the industry is currently at capacity, is highly manual, has not innovated independently, and cost saving initiatives always start with substituting people with technology.
- Uncover the harder to determine costs such as implementation shortfall, bid/offer spread comparisons, the true cost of Private Equity Funds, and so on (Fig. 1).
Ultimately the goals are to make pensions cheaper, more accessible, offer better performance and growth, and be altogether fairer.
A Proposed Delivery Model
- Pension Research Institute. The ESRC is considering the creation of a Pension Fund Research Institute in the UK. Ideally the model would be a distributed research capability that co-ordinates with, and is collaboratively funded by, industry but is completely independent and neutral. This is similar to the Dutch NETSPAR model. FSKTN has been working with the ESRC to bring the IMA and NEST in as partners, and for some of the research to occur within a neutral venue (e.g. FiNexus)
- Pension Fund Database. The purpose is to collect data with data owners’ permission (Pension Funds), sanitise it where necessary and make it available within a neutral venue (FiNexus) to academics and innovators for research. We are working with the LGPS and Unison to gain agreement to access the relevant data from their suppliers such as Asset Managers, Custodians, Brokers and Pension Fund Consultants for this enormous dataset.
- Development of new consumer interfaces. Working with industry, innovators and STFC Hartree to develop mobile apps allowing educated pension fund purchase/transfer.
- Visualisation of complex financial products. Again using STFC Hartree capability in collaboration with industry to develop new visualisation methods to help consumers understand pension products.
Figure 1 – Cost and Fee breakdown in the Pensions Fund value chain