By Matt Fletcher, Adele Groyer and John Roberts


 COVID-19 Actuaries Response Group – Learn. Share. Educate. Influence.
Summary
Updated SAGE papers have been published setting out modelling of the impact of easing restrictions in England – in particular, moving to Step 4 of the roadmap on July 19th, delayed from June 21st. As in June, the publications include detailed modelling papers by three teams and an overall summary.
As in our June bulletin (link), we summarise the number of deaths that are projected under some of the key scenarios set out in the papers. We also comment on hospitalisation figures where possible.
Whilst the three models all use slightly different approaches and periods, they now appear much closer in terms of central projections (to the extent they exist), being in the order of 30,000 to 40,000 deaths over the next few months. Many scenarios show daily hospitalisation peaks below that of the second wave peak but there are scenarios where this may be exceeded. However, peaks in deaths are likely to be considerably lower than those seen in January 2021.
The consensus document highlights that all models are subject to considerable uncertainty. The main uncertainties (and thus sensitivities) remain vaccine efficacy, where even an apparently small change can have a large impact in the results, and the extent to which the population exercises its restored freedom. The Prime Minister, announcing the decision to go ahead next Monday, encouraged people not to “tear the pants off it”, quoting a memorable phrase from earlier in the pandemic. A briefing on the outputs of these models may well have been behind the caution expressed – it is a cautionary note that we would agree with, given the risks involved in the removal of restrictions.
Overview of the papers
The original papers published are:
- SPI-M-O summary (link)
- University of Warwick (link)
- London School of Hygiene and Tropical Medicine (LSHTM) (link)
- Imperial College London (link)
Additionally the “JUNIPER” consortium has produced a further analysis () which we have not commented on, preferring to focus on the three teams underlying the equivalent June outputs.
In addition to considering this bulletin and the papers themselves, we would recommend that interested readers should consider investigating the following Twitter threads by the authors of two of the papers:
Warwick model
The model set out in Warwick’s June paper, assuming a Step 4 date of 26 July and a Delta transmission advantage (over Alpha) of 56%, gave an estimated number of deaths to June 2022 of 8,500.
In their July paper, their model appears to be projecting higher numbers of deaths and hospitalisations than the June paper. The new model projects deaths and hospitalisations up to June 2023 so is unfortunately not directly comparable, either with previous projections or with other models. However, charts in their report suggest that the majority of deaths in their main scenarios occur in the next 12 months so figures should be reasonably consistent.
Warwick’s paper sets out seven indicative scenarios, without any specific scenario being picked out as their central estimate. All scenarios generate large peaks of hospital admissions in August and September, with modelled numbers being 668 to 2,490 peak hospital admissions per day using the central efficacy assumptions.
All scenarios on the default vaccine efficacy assumptions result in significant numbers of COVID deaths up to June 2023, with the lowest being around 24,000 and the highest around 47,000.
Central assumptions on efficacy against Delta (bracketed figures for AstraZeneca) are similar to or higher than the June projections, suggesting this is a not a driver of the higher figures for deaths:
| June Projection | July Projection | |||
| 1st Dose | 2nd Dose | 1st Dose | 2nd Dose | |
| Hospitalisation | 64% | 90% | 80% | 93% (90%) |
| Death | 60% | 96% | 80% | 97% (95%) |
| Transmission | 45% | 45% | 45% | 45% |
Warwick also indicate the sensitivity to vaccination assumptions (in particular, the exact degree of uptake in older people and the effectiveness of the vaccines).
In contrast to their previous paper, which assumed a single step change to previous behaviours and hence a step increase in transmission on 19 July, Warwick have modelled various gradual returns to pre-pandemic behaviour between August 2021 and March 2022. The paper shows that the outcome is very sensitive to relatively small changes in assumed changes in behaviour.
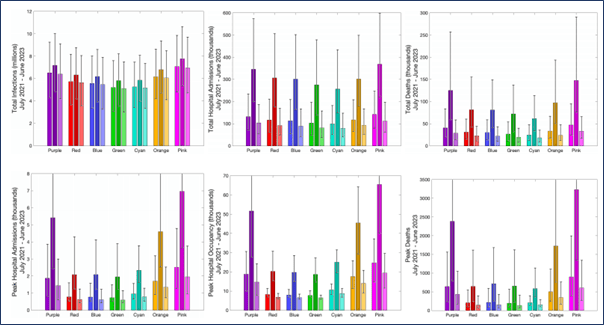
This extract from figure 3 shows the assumptions made in Warwick’s indicative scenarios on changes in precautionary behaviour:

The purple, red, blue and green scenarios assume different levels of smooth transition to pre-pandemic behaviours (after a small step change at the start of stage 4), with purple being the fastest change and green the slowest.
The cyan, orange and pink scenarios assume smooth transition after larger initial falls in precautionary behaviour once stage 4 is entered – in the pink scenario, pre-pandemic levels are reached very quickly, whilst in the cyan scenario there is only a moderate fall followed by a longer transition.
This chart (below) from Appendix 3 shows the range of outcomes from the different scenarios – for each scenario, there are three bars, the left being the default vaccine efficiency assumptions, the centre being cautious assumptions and the third optimistic. It is clear that the pink scenario with cautious vaccination assumptions produces the most extreme outcomes of up to 150,000 deaths (noting this relates to the projection to mid-2023).
LSHTM model
In contrast to the Warwick model, the base LSHTM model projection is for a substantially reduced level of deaths in comparison to the June version, although hospitalisations are much less reduced, and the peak level of occupancy actually increases. As a result, the model is no longer the outlier it was last time. The table below is focussed on the central projections (albeit using a late July Step 4 date throughout) and covers the periods from 21 June or 1 July to 31 December 2021 respectively for the two publications.
| June | July | Change* | |
| Deaths | 62,300 | 34,000 | -45% |
| Hospitalisations | 222,400 | 190,000 | -15% |
| Peak Occupancy | 16,000 | 18,000 | +13% |
*Ignores minor difference in periods covered
There are several differences in terms of assumptions which appear to drive this reduction.
Firstly, efficacy against Delta assumptions are improved, most notably after one dose. We show the mRNA vaccine efficacy figures in the table below (but note that the evolution of corresponding efficacy metrics for AstraZeneca are in general similar).
| June Projection | July Projection | |||
| 1st Dose | 2nd Dose | 1st Dose | 2nd Dose | |
| Hospitalisation | 71% | 87% | 85% | 90% |
| Death | 71% | 92% | 85% | 95% |
| Transmission | 33% | 56% | 47% | 57% |
The effect of these changes on the projections is determined by considering the corresponding vaccine escape figure. So as an example, deaths (after 2 doses) escape reduces from 8% to 5%, a reduction of 37.5%, all other things being equal. This is likely to be the main contributor to the reduction of deaths in the base assumption.
A second key change is in the extent of waning immunity, where LHSTM was previously more pessimistic than the other models. This has been reduced from a waning of 15% over a six-month period to a full year. Even with this lesser assumption, waning immunity still results in a near tripling of deaths from 12,000 to 34,000.
A key unknown is how people will respond to the relaxation of restrictions from the 19th, and thus the extent of any third wave. The sensitivity of the model to this effect is considerable, with the range of outcomes broadly showing a doubling between the lowest and highest levels considered.
The scenarios are expressed either as a change in mobility, or alternatively in the extent to which protective measures are reduced. In broad terms, both of these give similar outcomes as shown below.
| Base | Mobility | Reduction in Protective Measures | ||||
| Low | High | Low | High | Very High | ||
| Hospitalisation | 190,000 | 140,000 | 270,000 | 150,000 | 220,000 | 250,000 |
| Deaths | 34,000 | 24,000 | 50,000 | 27,000 | 40,000 | 46,000 |
| Peak Occupancy | 18,000 | 16,000 | 23,000 | 14,000 | 23,000 | 30,000 |
Imperial model
Finally, we turn to the Imperial model. Its team highlights that their projections are particularly sensitive to small changes in assumptions regarding vaccine effectiveness against the Delta variant (as indeed we have described above in relation to LSHTM).
Assumptions about vaccine effectiveness against death have changed as follows since the June version:
| June Projection | July Projection | |||||
| Optimistic | Central | Pessimistic | Optimistic | Central | Pessimistic | |
| AstraZeneca
1 Dose |
78% | 73% | 68% | 81% | 80% | 75% |
| AstraZeneca
2 Doses |
87% | 85% | 77% | 95% | 95% | 95% |
| Pfizer 1 Dose | 76% | 73% | 68% | 93% | 85% | 80% |
| Pfizer 2 Doses | 90% | 89% | 84% | 98% | 95% | 95% |
Moving to a minimum efficacy of 95% for 2 vaccine doses is a significant shift. Instead of the 15% central escape modelled in June for AstraZeneca, an assumption of 5% has been used – one third of the previous assumption. For full Pfizer vaccination, the escape assumption has roughly halved compared to last month’s model on the central assumptions. Assumptions for efficacy have also become more optimistic for first doses in the latest model.
The results are also sensitive to the reproduction number (R) of Delta after Step 4. To capture the easing of restrictions, Imperial model a range of average values for R in the absence of natural and vaccine-induced immunity, in particular:
- Central = 5.5 (approximately a doubling of contacts after Step 4 and used as the central assumption)
- Low = 4.5 (approximately 1.5x pre-lifting contact rates), or
- High = 7.0 (approximately 2.5x pre-lifting contact rates).
They also model three scenarios for the timing of the impacts of Step 4:
- 19 July with immediate impact on transmissibility
- 16 August immediate impact on transmissibility
- 19 July with gradual increase in transmissibility to the central R assumption by 1 September 2021.
The table below shows that the projected number of deaths until mid-2022 from an immediate impact of Step 4 on 19 July is in a similar range to the results on central assumptions projected in the June model for a 26 July easing of restrictions, although there will have been adjustments in multiple places in the model and the more optimistic assumptions about vaccine efficacy should have reduced these figures.
The table also shows the extent of the model sensitivity to vaccine efficacy. Pessimistic assumptions roughly double the numbers of deaths and hospitalisations. Pessimistic assumptions about ongoing contact rates after Step 4 increase the projected figures by a factor of 1.5.
Delays to taking Step 4 or delayed behaviours in response to this step have only a marginal impact of 5% to 10% reductions in deaths and hospitalisations under the model assumptions of no new interventions beyond taking this step. The confidence intervals are slightly narrower under the delayed scenarios.
The Imperial paper shows peak hospitalisations in graphical format only. Under the central vaccine efficacy scenarios, the daily hospitalisation projection includes a peak that exceeds the winter second wave peak at some point in most contact scenarios (central immediate increase, central gradual increase and high increase) after taking Step 4 on 19 July.
| Model version | Vaccine efficacy | Step 4 Date / impact | Reproduction number (proxy for contact rates) | Cumulative Deaths | Cumulative Hospital Admissions |
| June 2021 | Central | 21-Jun | 47,941
(21,723 – 86,506) |
||
| Central | 26-Jul | 34,743
(21,767 – 58,718) |
|||
| July 2021 | Central | 19 July, immediate | Central | 36,700
(20,600 – 59,200) |
283,500 (161,800 – 445,400) |
| Optimistic | 19 July, immediate | Central | 14,600
(8,200 – 24,400) |
118,600
(69,400 – 196,100) |
|
| Pessimistic | 19 July, immediate | Central | 79,700
(48,100 – 117,500) |
579,100 (355,400 – 832,000) | |
| Central | 19 July, gradual to 1 Sept 2021 | Central | 33,700
(21,600 – 48,000) |
258,300 (173,600 – 360,000) | |
| Central | 16 August, immediate | Central | 35,300
(22,200 – 48,700) |
270,600 (178,400 – 370,200) | |
| Central | 19 July, immediate | Low | 22,900
(11,100 – 45,300) |
179,600
(87,500 – 347,900) |
|
| Central | 19 July, immediate | High | 57,300
(38,700 – 77,700) |
431,600 (304,000 – 580,100) |
The cumulative figures in the two right-hand columns are over the period 2 July 2021 to 1 June 2022.