
Friday Report: Issue 51 http://www.covid-arg.com
By: John Roberts, Matt Fletcher, Nicola Oliver & Adele Groyer


COVID-19 Actuaries Response Group – Learn. Share. Educate. Influence.
COVID-19 is still one of the hottest topics for scientific papers and articles. The COVID‑19 Actuaries Response Group provides a regular Friday update with a summary of key papers and articles.
Vaccination
Worldwide, there are now 22 vaccines for COVID-19 that have gained regulatory approval (link).
As of 14 September 2021, the count of potential vaccines in clinical trials is: (link)
| Stage | Phase 1 | Phase1/2 | Phase 2 | Phase 2/3 | Phase 3 |
| Vaccine Candidates | 37 | 28 | 8 | 10 | 24 |
Chief Medical Officers Support Vaccination for 12 to 15 Year Olds (link)
In the first of two announcements this week, the four Chief Medical Officers in the UK have unanimously recommended that a programme of vaccination for younger teenagers is commenced, with one dose of the Pfizer vaccine offered (similar to 16 & 17 year olds, where a decision has yet to be made on a second dose). This follows previous advice from the JCVI that held back from recommending vaccination, but suggested that CMOs may consider wider aspects of children’s health than the purely clinical assessment which JCVI’s remit is limited to.
The programme will be schools-based, with provision also made for those not attending school for any reason. The announcement notes that parental consent will be sought, although in answer to questions on this point, it has been noted that Gillick Competence will be considered in the event of an unresolvable difference of opinion between the child and the parent.
Booster Doses Confirmed for Priority Groups 1 to 9 (link)
The following day the long-awaited decision regarding booster doses was announced, with roll-outstarting yesterday. Following a provisional JCVI statement in June, there had been an expectation that a booster programme would commence in the Autumn, although in recent weeks there had been some doubt as to the extent of the programme.
In the end, the decision is to offer everyone in the original Priority Groups 1 to 9 a booster jab, i.e., over 50s, Health & Care Staff, Extremely Clinically Vulnerable and “At Risk”. This amounts to around 31m people.
One dose of the Pfizer vaccine or half a dose of the Moderna vaccine will be administered, the latter having shown to be as effective as a full Pfizer dose. Where either of these are inappropriate for clinical reasons, the Astra Zeneca vaccine will be offered instead.
The earliest a booster will be offered is six months after a person’s second dose. This enables us to predict the likely speed of the roll-out, as we have cumulative data on the second dose roll-out. Possibly surprisingly, as of the announcement date, only 1.6m people will be instantly eligible for a booster dose, and the programme will extend right through until Christmas, as shown below, with a peak rate of around 2.5m per week.
Clinical and medical news
Receipt of mRNA Covid-19 Vaccines and Risk of Spontaneous Abortion (‘Miscarriage’)

The NEJM this week published correspondence from the CDC v-safe Covid-19 Pregnancy Registry Team (link) who report on their findings from a study which sought to estimate the risk of spontaneous abortion after receipt of an mRNA Covid-19 vaccine.
Life table methods were used to calculate the cumulative risk of spontaneous abortion according to gestational week. More than 2,500 participants were included, and the authors report that the risk of spontaneous abortion after mRNA Covid-19 vaccination either before conception or during pregnancy is consistent with the expected risk (that is, there is no evidence that the risk is increased by vaccination).
Daily COVID testing in schools
With so many missed days in school due to extended periods of having to self-isolate, a large team of researchers including those from University of Oxford, ONS, Queen Mary University, London, DHSC, HPR to name a few, conducted an open-label RCT of daily contact testing in order to see whether this resulted in similar control of transmission, while allowing more school attendance.(link)
The study took place in secondary schools and further education colleges in England. Schools were randomly assigned (1:1) to either a policy of offering contacts daily testing over 7 days to allow continued school attendance (intervention group) or to follow usual policy of isolation of contacts for 10 days (control group).
The coprimary outcomes, across all students and staff, were (1) the number COVID-19-related school absences among those otherwise eligible to be in school and (2) the extent of in-school SARS-CoV-2 transmission.
Despite some challenges in the process, and following consideration of potential variables where possible, the authors report that switching from isolation at home to daily contact testing, at least in the settings of the schools studied, kept rates of symptomatic COVID-19 in students and staff at similar levels. This could allow for continued school attendance.
Remdesivir – no clinical benefit
Remdesivir, an antiviral drug currently approved to treat hepatitis C, has been studied on numerous occasions to test its utility against COVID-19. The latest trial results (link) report another round of disappointing results.
DisCoVeRy is a multicentre, open-label, randomised, controlled trial evaluating the safety and efficacy of repurposed drugs on the clinical status of adult patients admitted to hospital with COVID-19. No clinical improvement was observed at day 15, or day 29, and no mortality reduction was reported in those receiving Remdesivir.
NHS to roll-out Ronapreve (link)
A new treatment, Ronapreve, which is a combination of two monoclonal antibodies, casirivimab and imdevimab is to be used from next week in the UK to treat those patients who have not mounted an antibody response. Immunocompromised patients, such as those undergoing cancer treatment, are likely to be beneficiaries, as well as those who have failed to develop antibodies either through infection or vaccination. Antibody testing will be used to determine patients eligibility for the treatment, with those found to be seronegative being eligible.
Patterns of compliance with COVID-19 preventive behaviours
The COVID-19 Social Study, a large panel study of the psychological and social experiences of over 70 000 adults (aged 18+) in the UK during the COVID-19 pandemic, provided data for analysis in this paper which sought to explore patterns on self-reported compliance with six COVID-19 preventive behaviours (link).
The six behaviours included hand washing, face mask wearing, social distancing, household mixing indoors, household mixing outdoors and compliance with other guidelines. The authors assessed a range of demographic, socioeconomic and personality trait characteristics as predictors of compliance behaviour.
The figure below shows the distribution of compliance by behaviour.
Response categories are: 1. Never, 2. Rarely, 3. Occasionally, 4. Frequently, 5. Always.
Items on household mixing were phrased with higher values indicating lower compliance, and so are reverse coded for consistency with the other items.

Reported compliance was high; a notable finding given that data were collected 8 months after the first lockdown in the UK and fears at the beginning of the pandemic that extended lockdown may induce ‘behavioural fatigue’.
Compared with full compliers, there was clear evidence that frequent compliers have lower confidence in government, lower empathy, and a greater external locus of control, are younger, more risk taking, have lower trait openness, are less conscientious and are less likely to have been self-isolating at first data collection or have a long-term condition.
SARS-CoV-2-specific antibody responses in obese individuals
In this pre-print paper (link), the potential that excess bodily fat may somehow present a problem in the immune response to a COVID-19 vaccine is explored. It is known that obese individuals are at increased risk of more severe disease.
In particular, the study looks at abdominal adiposity and evaluated SARS-CoV-2-specific antibody responses after the first and second dose of the Pfizer mRNA vaccine comparing the response of individuals affected by abdominal obesity (AO) to those without. Measuring obesity through AO is a better indicator of adiposity than BMI.
This study is an ongoing observational prospective cohort study that started in January 2021 and will last until March 2022. The participants, n = 1060, are healthcare workers at a large academic medical centre in Milan, Italy.
Antibody levels were measured at four time points: at baseline, at day 21 after vaccine dose-1, at one month (within 30-40 days) and three months (within 90-100 days) after dose-2.
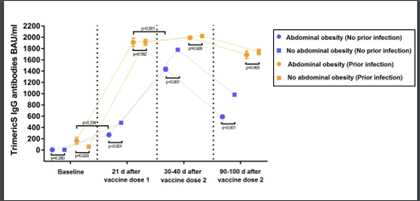
The figure above displays antibody response to mRNA SARS-CoV-2 vaccination in individuals with or without abdominal obesity, discerning between individuals with or without prior SARS-CoV-2 infection. It shows that antibody levels were significantly lower in individuals with AO than in those without AO.
Multimorbidity and risk of severe SARS‑CoV‑2 infection
In this study (link), UK Biobank data was linked to Public Health England COVID-19 infection and mortality data between March and July 2020. Among 360,283 included participants, 1,706 had severe SARS-CoV-2 infection. Multimorbidity was defined as the presence of two or more of the following: angina, asthma, atrial fibrillation, cancer, chronic kidney disease (CKD), chronic obstructive pulmonary disease (COPD), diabetes mellitus, heart failure, hypertension, myocardial infarction, peripheral vascular disease and stroke. Modelling made adjustments for effects of other factors including age, sex, ethnicity, deprivation, smoking status and body mass index.
Multimorbidity was independently associated with a greater risk of severe SARS-CoV-2 infection (adjusted odds ratio 1.91 [95% CI 1.70, 2.15] compared to no multimorbidity). The risk remained consistent across potential effect modifiers, except for greater risk among older age. The highest risk of severe infection was evident in those with CKD and diabetes (adjusted odds ratio 4.93 [95% CI 3.36, 7.22]).
Modelling
Updated SPI-M-O models
The SPI-M-O groups from Warwick University, Imperial College and the London School of Hygiene and Tropical Medicine have presented updated Covid-19 scenarios for the UK for autumn and winter to SAGE (link). These are based on the modelling done for Step 4 of the Roadmap in July but now take into account data up to 6 September. Key messages from the consensus statement by the groups are:
- The UK is currently experiencing high prevalence of Covid-19 infection.
- Hospital occupancy in England is currently around 6,200, compared with the January peak of 34,000.
- The best estimate for R in England is between 0.9 and 1.1. Changes in behaviour linked to the end of the school holidays and reduced homeworking mean that we are entering a period of uncertainty where growth rates may increase. Homeworking has played a very important role in preventing sustained epidemic growth in recent months.
- Compared to previous model outputs, recent hospital occupancy and deaths have been lower than expected under central assumptions, largely linked to behaviours. The autumn/winter trajectory is likely to be a mixture of previously modelled scenarios but with delayed peaks which may persist for longer than those originally estimated.
- The chart below shows the sensitivity of daily hospital admissions to three R values sustained over 8 weeks. The scenarios for R are 2.0 (red), 1.5 (blue) and 1.1 (green). (Note that the peak of the red line is cut off in the original.)

- The red trajectory is considered to be highly unlikely while blue and green attempt to provide an “envelope” which contains the likely epidemic trajectory over the next couple of months, not taking into account any measures that may reduce the growth rate but also ignoring possibly waning immunity.
- A relatively light set of measures, enacted early enough, is likely to be enough to curb sustained slow growth. Suggested measures include:
- Encouraging home working
- Clear messaging about behaving cautiously
- A return to requiring all contacts of cases to isolate
- More mask wearing
Monitoring actual and modelled hospitalisations
We first monitored actual hospitalisations in England against projections in Friday Report 48 (link). This updated our bulletin (link) summarising papers from London School of Hygiene and Tropical Medicine (LSHTM), Warwick University and Imperial College London which modelled the move to step 4.
The chart below shows an updated actual trajectory of hospitalisations in England against four of the projections produced by the groups:
- LSHTM central model (assuming waning immunity of 15% over the next 12 months)
- Warwick “green” and “pink” models which represent the two extremes of their assumptions on precautionary behaviour
- “Green” assumes a gradual move towards pre-pandemic behaviour over the period to March 2022
- “Pink” assumes an immediate step-change to a state close to pre-pandemic behaviour, with a full return to pre-COVID mixing reached by September 2021
In order to see the actual figures more clearly, we have removed the central Imperial projection which indicated much higher levels of hospitalisation than the other models.

This update shows that actual hospitalisations (blue) have been broadly level over recent days. They are tracking below the LSHTM estimate (though approaching a similar level as LSHTM projections peaked in August and fell to roughly current levels at the end of September) and above the Warwick “green” estimate, which is towards the lower end of the trajectories produced in the initial modelling papers.
We will continue to track the figures on a regular basis.
Data
Prevalence of long COVID in the UK
ONS have published (link) updated experimental estimates from three approaches to estimating the prevalence of long COVID in the UK. They’ve also published a blog (link) discussing the findings.
Based on a sample of over 20,000 Coronavirus Infection Survey participants, using data up to 1 August 2021, ONS’s latest estimates of the prevalence of symptoms remaining 12 weeks after COVID-19 infection (a common definition for “long COVID”) are:
- 0% reporting any of 12 common specific symptoms for a continuous period of 12 weeks from infection – this compares to 0.5% in a control group without a positive COVID-19 test.
- 0% reporting any of 12 common symptoms at any point 12 to 16 weeks after infection – here the control group prevalence of 3.4%, indicating that symptoms are relatively common in the population at large
- 7% based on self-reported long COVID (rather than reporting any of the 12 common symptoms), falling to 7.5% that resulted in limitation to day-to-day activities
For reference, the 12 symptoms tracked were: fever, headache, muscle ache, weakness/tiredness, nausea/vomiting, abdominal pain, diarrhoea, sore throat, cough, shortness of breath, loss of taste and loss of smell.
The 12-week prevalence estimate using this approach has fallen from 14% in April 2021 to 3% now, partly due to methodological updates and partly because more is now known about participants’ long-term symptoms. The remaining results indicate how sensitive estimates of long COVID are to the exact way in which the surveys are carried out.
PHE Data on Waning Immunity (link)
A major study on waning immunity was published in conjunction with the announcement of the booster programme. This clearly shows waning of efficacy over time, although care needs to be taken in terms of confounding factors. In particular, due to the age profile of the roll-out, the longer post-vaccination durations are likely to consist of more data in respect of older lives. Of interest, waning appears greater for the AZ jab, in contrast to the ONS study we reported in Report 50.
When assessing the impact of waning efficacy, for example in predicting hospital admissions, it’s important to look at the balancing figure, rather than the headline efficacy. As an example, a waning from 95% to 90% may not appear significant, but it doubles the number of breakthrough cases (from 5% to 10%), which clearly is a very material change.
Somewhat curiously, a similar paper for the 9th Sep SAGE meeting (link) was also published on the same day, but with the data cut-off two weeks earlier. There are some materially different figures, notably in respect of AZ, which would lead one to conclude that immunity is waning at a much faster rate. Whilst there is logic behind the difference, there is clearly scope for confusion in publishing two conflicting reports from the same study simultaneously.


ONS Mortality Rates by Vaccination Status (link)
An analysis of mortality by vaccination status on an age-standardised basis by the ONS confirms that those fully vaccinated are experiencing much lower levels of COVID deaths. In the most recent four week (broadly covering June) the age-standardised mortality rates for the unvaccinated cohort is around ten times higher than for those fully vaccinated.
An interesting point in the data is that non-COVID deaths are also higher in the unvaccinated group (by around 75% over the same four week period). The reasons for this are unclear, although we know that the demographic characteristics of the unvaccinated are skewed towards the more deprived and ethnic minorities, who generally experience higher mortality, so this may simply be a reflection of that mix in the unvaccinated population.

ONS Infections (link)
The latest data from the weekly ONS surveillance of infection prevalence, shows a mixed picture across the UK. England, whilst falling slightly, has been broadly flat for several weeks now, in contrast to the ups and downs we have seen with other data, notably daily cases. Wales and Scotland have risen slightly, whereas there has been a more substantial fall in Northern Ireland, continuing a recent trend.
Possibly of more concern is that the modelling shows an increasing prevalence in the Over 70s, which are of course the group most likely to require hospitalisation. The figure below shows the recent increase, although it should be noted that modelling the latest week does involve more uncertainty. Nevertheless, this is clearly one trend to watch closely in coming weeks.

ONS Antibody Prevalence (link)
The latest UK antibody surveillance by the ONS shows rates for 16+ continue to be above 90%, with the range in the four countries between 91.2% and 93.6% for the week ending 29th August. With vaccination of 16 and 17 year olds starting in early August, there’s a noticeable increase in antibodies in the youngest group (16-24).
Of most interest, there is now clear evidence of modest waning in the older age groups. This can be seen by taking the underlying data and charting the 70+ age groups since May, as shown below. We see that for those in their seventies, the level has fallen from 96% to 92% in around two months. Put another way, in terms of the potential impact on serious illness and pressure on the NHS, the number without discernible antibodies has doubled from 4% to 8%.
Whilst the ONS is careful to remind readers that the relationship between prevalence as measured here and immunity is more complex than a simple direct relationship, with other data also suggesting waning immunity, this survey provides more evidence to support the decision on booster vaccinations discussed earlier.

PHE Deaths & Hospitalisation Rates by Vaccination Status (link)
PHE’s weekly Vaccine Surveillance Report, already a very comprehensive document, was enhanced last week with a much more detailed split by age of cases, admissions and deaths by vaccination status, including rates per 100,000 of population.
Unfortunately, what should have been a widely acclaimed piece of work was instead the subject of some controversy, as the data used for estimating the population sizes (NIMS*) is believed to significantly overestimate the totals. In doing so it materially overestimates the unvaccinated populations, and thus understates the rates per 100,000. The consequence is that the comparisons show the unvaccinated groups more favourably in the comparison than is believed to be the case by using ONS population data. This was highlighted by a tweet from ITV News (now deleted) in which Robert Peston suggested (as the data showed) that at certain ages you were more likely to be infected if you had been fully vaccinated.
Nevertheless, for hospitalisations and deaths there is still a very clear benefit, as the most recent data shows below, even with this flaw in the data.
*NHS Immunisation Management Service

“R” Estimate (link)
For the third week running the estimate for England, published today by the UK Health Security Agency, is between 0.9 and 1.1, reflecting the finely balanced situation at the moment.
The regional estimates are shown below, and somewhat unusually they are very consistent, with only the South East being out of line, and even then only to a small degree.

Other
Direct and Indirect Health Impacts of the Pandemic (link)
As we finalised this week’s report, a major study for SAGE on the wider health impacts of the pandemic over the first year was published. At 118 pages long it deserves more analysis than is possible here, but a couple of key points are in relation to mortality and morbidity and the impact on the demand and supply of other health services.
The paper estimates that over 700,000 Quality Adjusted Life Years (QALY) were lost as a result of deaths in the first 13 months. With around 100,000 actual deaths, the precise number depending on the definition used, we can see that the average lifespan in good health lost has been around 7 years.
Similarly, the paper estimates around 150,000 QALY have been lost to morbidity in just the first 12 months.
In respect of health services, it notes that demand for GP services fell in 2020, with the biggest fall being for children. In terms of supply, we can see from the second table below that there were dramatic falls in appointments and admissions, both elective and emergency, which will undoubtedly have contributed to the high waiting lists we now have throughout the NHS.
For those wanting a slightly shorter read, an 18 page summary is also available here. (link)


And Finally…
You are not a horse. You are not a cow. Seriously, y’all. Stop it.
In a change to its more conventional tone of communication, the FDA (link) has reminded people of their species in an effort to prevent human use of Ivermectin, in which certain animal formulations of ivermectin such as pour-on, injectable, paste, and “drench,” are approved in the U.S. to treat or prevent parasites in animals.
The FDA has not authorized or approved ivermectin for the treatment or prevention of COVID-19 in people or animals. Ivermectin has not been shown to be safe or effective for these indications.

Meanwhile, whilst on the subject of equine involvement with COVID-19, we finish this week with a story from South Africa (link) of an 18 and 24 year old travelling to their vaccination centre by horse and cart. Maybe for once Ivermectin has helped these two become protected against the virus.

17 September 2021