
The Pensions Regulator has published new information (DC trust: scheme return data 2021 to 2022) that shows just how the DC landscape has changed and is changing for trust-based workplace pension schemes in the UK.
It reinforces the message that schemes are getting fewer and bigger
- There are now only 27,700 schemes , of which 22,530 (81%) are “micro”.
- Since the beginning of 2012 the number of non-micro schemes, including hybrid schemes, has declined by 63% (from 3,660 to 1,370) .
Figure 1: Occupational DC schemes by membership size group (including hybrid schemes) (2012-2022)
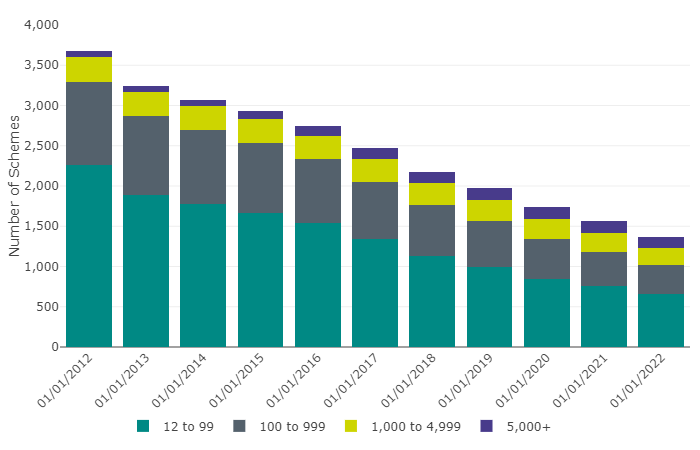
The contraction of non micro schemes is continuing at a pace. The total number of non-micro schemes, including hybrid schemes, has declined by 12% in the past year .
Schemes have reduced in number but increased in membership
Table 1: Data underlying Figure 1, pertaining to occupational DC Schemes by Membership Size Group (including hybrid schemes) (2012-2022)
| Date | 12 to 99 | 100 to 999 | 1,000 to 4,999 | 5,000+ |
|---|---|---|---|---|
| 01/01/2012 | 2,260 | 1,030 | 310 | 80 |
| 01/01/2013 | 1,890 | 980 | 300 | 70 |
| 01/01/2014 | 1,780 | 920 | 290 | 80 |
| 01/01/2015 | 1,670 | 870 | 290 | 100 |
| 01/01/2016 | 1,540 | 790 | 290 | 120 |
| 01/01/2017 | 1,340 | 710 | 290 | 130 |
| 01/01/2018 | 1,130 | 630 | 280 | 140 |
| 01/01/2019 | 1,000 | 560 | 270 | 140 |
| 01/01/2020 | 840 | 500 | 250 | 150 |
| 01/01/2021 | 760 | 420 | 240 | 140 |
| 01/01/2022 | 660 | 360 | 210 | 140 |
Source(s): TPR: DC Trust: Presentation of scheme return data 2021 – 2022 (Table 1.2)
Memberships of occupational schemes continue to rise
This means more pots. As you will see if you read to the end of the blog, most of these “memberships” are now for people who have left employment. Pot proliferation happens because people aren’t consolidating pots as well as master trusts consolidating schemes.
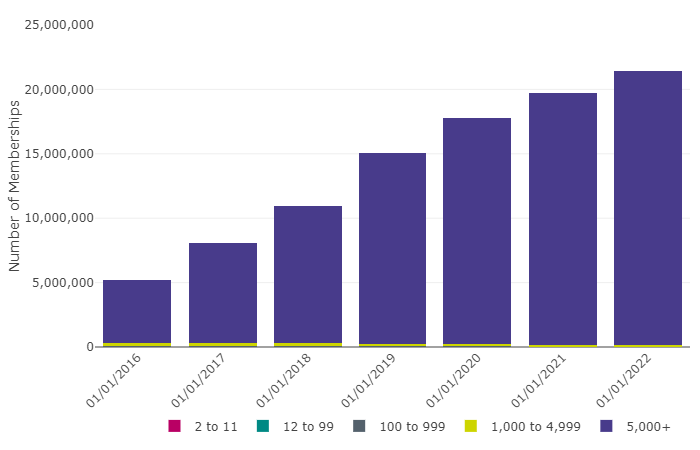
Figure 2: Memberships of occupational DC schemes by membership size group (including hybrid schemes) (2012-2022)
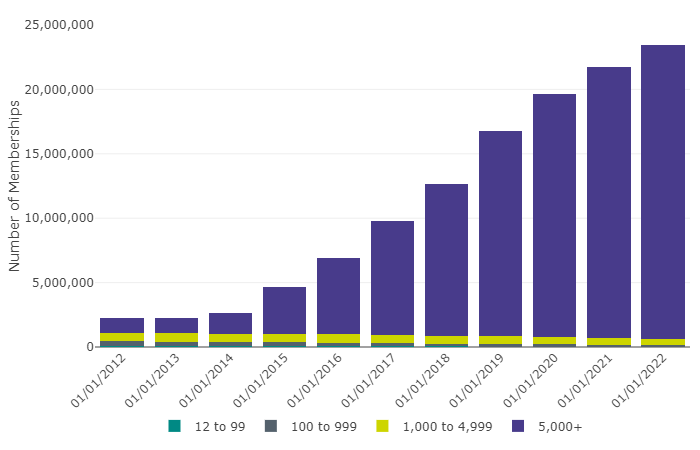
Membership increased by 8% over the past year (compared to 11% the previous year), and increased by 938% since the beginning of 2012.
All of the membership growth is in big schemes, fewer people save into small schemes
Table 2: Data underlying Figure 2, pertaining to memberships of Occupational DC Schemes by Membership Size Group (including hybrid schemes) (2012-2022)
| Date | 12 to 99 | 100 to 999 | 1,000 to 4,999 | 5,000+ |
|---|---|---|---|---|
| 01/01/2012 | 78,000 | 358,000 | 660,000 | 1,159,000 |
| 01/01/2013 | 65,000 | 342,000 | 663,000 | 1,196,000 |
| 01/01/2014 | 62,000 | 324,000 | 661,000 | 1,566,000 |
| 01/01/2015 | 60,000 | 307,000 | 635,000 | 3,666,000 |
| 01/01/2016 | 55,000 | 286,000 | 658,000 | 5,932,000 |
| 01/01/2017 | 48,000 | 260,000 | 646,000 | 8,866,000 |
| 01/01/2018 | 40,000 | 227,000 | 612,000 | 11,743,000 |
| 01/01/2019 | 36,000 | 205,000 | 594,000 | 15,934,000 |
| 01/01/2020 | 31,000 | 183,000 | 569,000 | 18,833,000 |
| 01/01/2021 | 28,000 | 158,000 | 542,000 | 20,994,000 |
| 01/01/2022 | 25,000 | 138,000 | 482,000 | 22,767,000 |
This suggests that if we are to see pot consolidation, it will come from large schemes finding ways to combine pots.
Assets have boomed in the past year.
(these numbers exclude DC schemes within DB schemes – called hybrids)
The boom in assets outstrips any boom in population or contributions. It is a result of buoyant markets so is investment driven.
Figure 3: Aggregate reported assets in occupational DC schemes by membership size group (excluding hybrid schemes) (2012-2022)
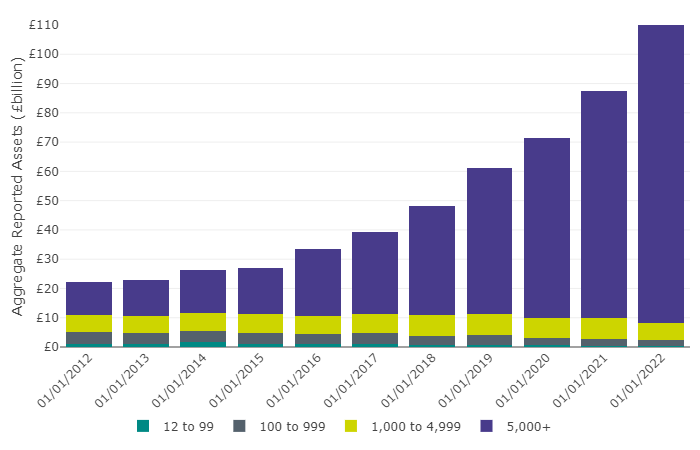
Aggregate asset values are now £113.5bn, an increase of £26bn or 30% since last year and 413% since the beginning of 2012.
This is good news for the large schemes
Most of the money is concentrated in a small number of schemes.
The concentration of wealth is in a very small number of well funded or well populated schemes.
Table 3: Data underlying Figure 3, pertaining to aggregate reported Assets in Occupational DC Schemes by Membership Size Group (excluding hybrid schemes) (2012-2022)
| Date | 12 to 99 | 100 to 999 | 1,000 to 4,999 | 5,000+ |
|---|---|---|---|---|
| 01/01/2012 | £1,122,000,000 | £4,108,000,000 | £5,872,000,000 | £11,040,000,000 |
| 01/01/2013 | £1,020,000,000 | £3,821,000,000 | £5,904,000,000 | £12,087,000,000 |
| 01/01/2014 | £1,759,000,000 | £3,808,000,000 | £6,092,000,000 | £14,812,000,000 |
| 01/01/2015 | £879,000,000 | £3,776,000,000 | £6,684,000,000 | £15,687,000,000 |
| 01/01/2016 | £883,000,000 | £3,436,000,000 | £6,398,000,000 | £22,902,000,000 |
| 01/01/2017 | £884,000,000 | £3,742,000,000 | £6,728,000,000 | £28,095,000,000 |
| 01/01/2018 | £780,000,000 | £2,985,000,000 | £7,099,000,000 | £37,266,000,000 |
| 01/01/2019 | £668,000,000 | £3,559,000,000 | £6,953,000,000 | £50,116,000,000 |
| 01/01/2020 | £559,000,000 | £2,433,000,000 | £6,948,000,000 | £61,312,000,000 |
| 01/01/2021 | £493,000,000 | £2,310,000,000 | £7,272,000,000 | £77,382,000,000 |
| 01/01/2022 | £417,000,000 | £1,893,000,000 | £5,788,000,000 | £105,449,000,000 |
but it doesn’t mean the problem of pot proliferation has gone away.
Average pot sizes are only beginning to recover since the staging of auto-enrolment
Figure 4: Average assets per membership in occupational DC schemes (excluding hybrid schemes) (2012-2022)
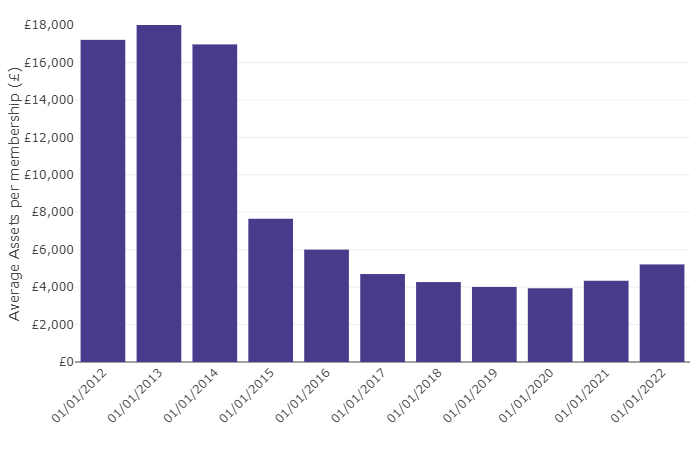
Average assets per membership have increased by 20% over the past year, but overall have fallen by 70% since the beginning of 2012. Pots continue to be too small to be manageable, people need to have ways to bring pots together.
| Date | Average Assets per membership (£) |
|---|---|
| 01/01/2012 | £17,206 |
| 01/01/2013 | £18,008 |
| 01/01/2014 | £16,963 |
| 01/01/2015 | £7,651 |
| 01/01/2016 | £6,002 |
| 01/01/2017 | £4,698 |
| 01/01/2018 | £4,268 |
| 01/01/2019 | £4,009 |
| 01/01/2020 | £3,938 |
| 01/01/2021 | £4,339 |
| 01/01/2022 | £5,212 |
Automatic enrolment (AE) is the only game in town
- 98% of memberships are in schemes being used for AE: 21.4 million out of 21.9 million
- All of this phenomenal growth is into large schemes with more than 5,000 membership.
Again the dynamic suggests that the consolidation of pots should be being driven by scheme consolidation.
| Date | 2 to 11 | 12 to 99 | 100 to 999 | 1,000 to 4,999 | 5,000+ |
|---|---|---|---|---|---|
| 01/01/2016 | 1,000 | 2,000 | 57,000 | 223,000 | 4,909,000 |
| 01/01/2017 | 1,000 | 3,000 | 58,000 | 212,000 | 7,811,000 |
| 01/01/2018 | 2,000 | 3,000 | 58,000 | 225,000 | 10,676,000 |
| 01/01/2019 | 2,000 | 3,000 | 52,000 | 193,000 | 14,776,000 |
| 01/01/2020 | 2,000 | 2,000 | 41,000 | 187,000 | 17,514,000 |
| 01/01/2021 | 1,000 | 1,000 | 30,000 | 162,000 | 19,502,000 |
| 01/01/2022 | 1,000 | 1,000 | 27,000 | 128,000 | 21,292,000 |
We now see all but a tiny fraction of pots being managed by schemes with more than 5,000 lives. This reinforces the need for these large schemes to get onto the pension dashboard as quickly as possible. The long tail of small schemes and micros is statistically an irrelevance.
Schemes consolidate – pots proliferate
The next trick will be to find a way to consolidate people’s pots. As Alistair McQueen’s tweet suggests, pots aren’t consolidating but proliferating.
New today. More stark evidence, stressing the need for the pension dashboards. Look at how the growth in deferred (small) pots is outpacing active pots. Savers are saving, but they need urgent help if they are to keep on top of their pensions. https://t.co/ovwIYx2Vg4 pic.twitter.com/qqFSebu21w
— Alistair McQueen (@HelloMcQueen) January 27, 2022
Finally, a request for next year….
A little moan about these numbers
It is hard to use this data to do more than a lot of hand waving. The distinction between micos, non-micros and hybrids is annoying.
In my view, micros aren’t trust based pensions in any practical sense and should be excluded from the discussion. Hybrids are very important and their inclusion or exclusion from tables distorts the picture as we go along.
Can TPR publish numbers consistently so that we exclude micros, include hybrids and can we get some meaningful comparators between contract and occupational workplace pensions?
There is also a good argument for showing exploring the relationship between master trusts and large occupational schemes. One of the big dynamics that is being reported is the transfer of sections of memberships – typically deferred members to master trusts from own- employer schemes.
We need to better understand the pensions aspects of the data , rather than the raw statistics.
Nonetheless, this is a helpful set of numbers and our best way of testing whether the Government’s scheme consolidation policy is working. In 2021 it certainly worked.
The behaviour of people who change job after a short time with their employer is very clear – they simply leave a small pot behind, expecting the trustees to look after it, and to pay for looking after it, until they reach retirement age. We need automatic consolidation of these small pots. With an opt-out for anyone that actually wants to keep that pot where it is.