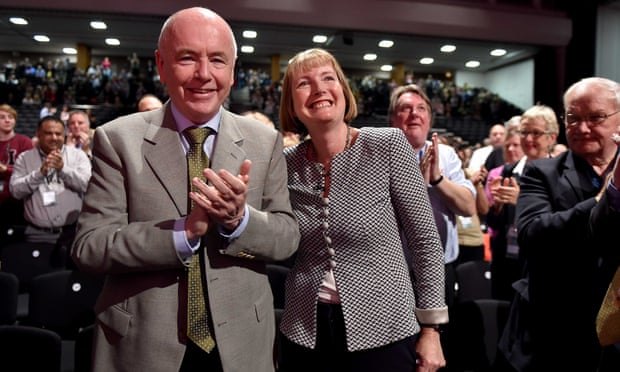
Posted in memory of Jack Dromey
The Office of National Statistics have produced their 7th update of its wealth and assets survey taking us to the very start of the pandemic in March 2020. These are their five key findings about wealth inequality in the UK
- Individual distribution of wealth; Wealth is unevenly distributed between individuals in Great Britain, with the wealthiest 10% estimated to hold around half of all wealth, primarily in the form of private pensions and property.
- The geography of wealth. Between April 2018 and March 2020, median individual wealth was £157,000 higher in the South East than the North East of England and this regional disparity has increased over time.
- The lifetime of wealth. On average individual wealth increases with age, peaking in the 60-to-64 age group at a level nine times as high as the 30-to-34 age group, before falling in older age groups as people use their wealth to support life in retirement.
- The gender of wealth. While age was the best predictor of individual wealth, wealth was also lower for women (negative £101,000 compared with men) and those with a longstanding illness or disability (negative £65,000 compared with those without), identifying as bisexual (negative £65,000 compared with heterosexual) or from several ethnic minority groups, after adjusting for other characteristic differences between groups.
- Education and wealth. An individual’s education and the way they make a living are also important factors for their wealth prospects, with positive associations modelled between wealth and degree-level qualifications, higher socioeconomic class occupations and public sector employment.
From these observations we can draw the general conclusion that highly educated men in their sixties living in the sixties are most likely to be wealthy. Turn this round and you can work out those most likely to be living in poverty.
So just how concentrated is wealth among the haves and just how limited is wealth among the have nots?
(I feel embarrassed to tick every box of the wealthy and be wealthy. My liberal values tell me I could be doing more for my fellow citizens)
This is what it means to be poor
For individuals in the poorest decile, most of their wealth comes from physical items such as household possessions and vehicles. Median net financial wealth in this group was zero, meaning that less than half of the poorest decile have financial assets such as savings and investments that outweigh their financial liabilities, such as outstanding credit card balances and loans. Similarly, less than half of respondents in this decile own property with positive equity or have any form of private pension.
This is what it is like to be rich
By contrast, most individuals in the highest wealth decile have positive bank balances (median net financial wealth £90,000), own property (median £310,000) and have a private pension pot to support their retirement (median £627,000). On average, respondents in the richest decile held 50% of their wealth in pensions and a further 32% in property.
This is what a good education means to people’s affluence
Taking education as an example, Figure 2 shows that from the surveyed population mean wealth was estimated to be more than £300,000 higher among individuals with a degree-level qualification (mean £478,000) than those without qualifications (mean £157,000).
But a good education is not just a matter of choice, it is a product of a range of social circumstance
The interactive table above shows a difference between these groups of less than £200,000 when other characteristics are controlled for. While a statistically significant association was estimated between wealth and education, a smaller modelled difference suggests that the difference in wealth between the two surveyed groups may be partially explained by other factors adjusted for in the analysis.
Put another way, how much we benefit from education is influenced by our sex, age, sexual orientation, ethnicity and disability.
If you want to be super woke, toggle using the downwards arrow at the top!
And wealth really is something of a postcode lottery!
The ONS has found that the gap between north and south and east and west has widened since the last survey.
Average wealth among individuals in the South East of England was higher than any other region of Great Britain. The difference in median individual wealth between the South East (£236,000) and North East (£79,000) regions of England was £157,000 in April 2018 to March 2020, almost twice as high as in July 2010 to June 2012 (£80,000 in nominal terms or £92,000 after adjusting for inflation).
For the average respondent in the South East of England, 33% of their wealth came from property compared with just 20% in the North East. Property ownership and property value explains a lot of the difference in average wealth between these regions.
Despite the South East having the highest house prices outside London, those living there were among the most likely to own property (64%) and had median net property wealth of £111,000. By contrast, those in the North East were the most likely to live in rented accommodation, except for London, where people are younger on average and see the highest house prices of any region.
And London living is the biggest lottery of all!
The majority of South East England is classed as Affluent England. This area classification supergroup had the highest median individual wealth. By contrast London comprises a mix of high and low wealth supergroups, from Affluent England (median £277,000) to Ethnically Diverse Metropolitan Living (£64,000) and London Cosmopolitan (£37,000). London had the highest mean to median ratio (4.1 compared with 2.4 for Great Britain) indicating high inequality in individual wealth of respondents living in this area.
Age matters for our wealth
Average wealth varied most by age, with median total wealth amongst respondents aged in their early 60s almost nine times as high as those aged in their early 30s.
Home ownership and preparations for retirement play significant roles in this divide, with median property wealth rising across all age groups and pension wealth peaking as individuals approach State Pension age. People typically accumulate wealth gradually over the course of their working life, building savings, paying into pension schemes and buying property, before using this wealth to support their life in retirement and often passing it on to younger generations.
Today’s younger generations are less likely to own their own home than their predecessors. This is noteworthy since living in a rented home was associated with lower wealth than mortgaged homes when controlling for age and other factors. Not only does a homeowner’s wealth grow as long as house prices rise, but buying property with a mortgage acts as a form of obligatory saving. Renting households are the most likely to be in problem debt, and have been shown to have lower financial resilience in the form of savings that could act as a buffer against unexpected expenses or losses of income.
While age was the best overall predictor of individual wealth, several other characteristics were associated with significant differences in wealth.
Our biology matters for our wealth
When holding other factors constant, wealth was estimated to be:
- £101,000 lower for women than men
- £65,000 lower for individuals with a longstanding illness or disability than those without
- £65,000 lower for individuals identifying as bisexual compared with those identifying as heterosexual
Wealth is lower for individuals from the Pakistani, Indian, Other Asian, White and Black African, Black African and Other ethnic groups, compared with the White British ethnic group
In addition to pay and increasing pension inequalities, household composition and the way wealth is divided when family dynamics change may contribute to the disparity seen between men and women.
Though the gender pay gap has fallen over the last 20 years, women still earn around 15% less than men. Differences in the types of jobs undertaken by men and women and an uneven distribution of caring and unpaid work are among explanations offered for this gap, together with time spent away from the labour market associated with having children.
Reduced time in the workforce, because of part-time working or career breaks, also heavily impacts the growth of private pension wealth. The gender pay gap is present across occupations and income groups, but is particularly noticeable in wealthier regions of England, such as London and the South East. Disability and ethnicity pay gaps may also contribute to differences in the accumulation of individual wealth, both larger in London than other regions of the UK.
Where we come from matters for our wealth
Average wealth was higher among UK-born respondents than those born outside the UK, but this association was not statistically significant when controlling for differences in other factors.
The ONS said there was evidence within the data to suggest associations between parental education, employment and homeowner status, and a child’s total wealth later in life. For example, wealth was £47,000 higher for individuals whose parents were buying or owned their teenage home than those whose parents rented, when controlling for other factors.
While the implications of a parent’s education or employment can change with generational shifts in attitudes and behaviour, parental homeownership may represent opportunities for the direct transfer of wealth through families.
How we make a living matters to our wealth – especially our pension wealth
An individual’s education and subsequent employment are also important factors for their wealth prospects. As noted earlier, average wealth was higher for those educated to degree-level, than those with lower or no qualifications. Despite high debts associated with university education, graduates earn higher wages and most can expect positive financial returns on their investment into university attendance
Median total wealth was almost 12 times higher among respondents who worked in higher managerial and administrative occupations or were employers in large organisations than those working in routine occupations. After age, this socioeconomic classification of occupations was the most influential factor considered in the modelling. Both income and expenditure levels increase with socioeconomic class. However, while disposable income and spending levels are roughly equal in poorer households, those in the top income quintile only spend around half their disposable income giving them far greater opportunity to build wealth through saving or other means.
Public sector employees had significantly more wealth than those working in the private sector. Earnings in the public sector have previously been estimated to be 7% higher when accounting for employer contributions to pensions and controlling for job, industry and personal factors.
A large proportion of total wealth among respondents employed in the public sector came from pension wealth (44% compared with 27% among private sector employees, before adjustment for age and other factors). This is likely to be explained by higher participation in workplace pensions, higher contribution rates and greater availability of defined benefit schemes for public sector workers.
Unlike pay, where part-time employees tend to be paid less per hour than those working full-time, average wealth was similar between respondents who worked full- or part-time in their current or most recent job. Adjusting for the imbalance in these working patterns between men and women, among other factors, led to a positive modelled relationship between part-time working and wealth.
While our part-time category covers a wide range of working patterns, the reasons people work reduced hours are equally varied, from availability of work and commitments outside the workplace to affordability. For individuals able to choose their working pattern, this choice may be influenced by living expenses and other sources of income within their household, factors not captured within the ONS analysis.
Demographic differences were also important when grouping workers by industry. Average wealth was lowest among respondents working in accommodation and food services, roles most commonly filled by the 16-to-24 age group. For young workers in this industry, lower wealth and in particular, lower financial assets relative to their income, put the economic well-being of many at risk when the coronavirus (COVID-19) pandemic impacted jobs in some industries more than others.
Jack Dromey RIP
This blog was written in memory of Jack Dromey who cared about these things.
Wanted to put in words how bereft I am at the loss of my Labour MP colleague and friend #JackDromey … and explain how he exemplified cross party working in @HouseofCommons 1/ pic.twitter.com/AyLwJwYpJH
— Guy Opperman (@GuyOpperman) January 8, 2022
Having served as a member of his advisory pensions commission, I am at a loss for words and can only say that he will be sorely missed.