
Friday Report: Issue 46
By: John Roberts, Matt Fletcher, Dan Ryan & Adele Groyer
-

- Dan
-

- Adele
-

- Matt
COVID-19 Actuaries Response Group – Learn. Share. Educate. Influence.
COVID-19 is still one of the hottest topics for scientific papers and articles. The COVID‑19 Actuaries Response Group provides a regular Friday update with a summary of key papers and articles.
Vaccination
CureVac Trials Disappoint (link)
With over 75m doses of three different vaccines now administered in the UK, it’s easy to forget that finding even one effective vaccine was by no means certain. The announcement by CureVac that initial results of its mRNA vaccine had failed to meet the 50% efficacy threshold deemed as the minimum acceptable for a vaccine to be approved reminded us of the difficulties.
At 47% the trial only just missed the minimum threshold, and CureVac says that it will continue the trial to acquire more data. However, with other established vaccines offering much higher efficacy it is clear that it will be difficult to achieve a marketable product.
A point of interest is how the ‘virus goalposts’ are moving, as the following slide shows – virtually none of the cases identified were of the original strain. With many of the later variants exhibiting a greater degree of vaccine escape, it’s not appropriate to compare the results with the original trial results for more established vaccine, with more recent real-world efficacy studies being a better comparison.

Reluctance to vaccinate children (age 12-15)
The Medicine and Healthcare Products Regulatory Authority (MHRA) approved the use of the Pfizer/BioNTech vaccine for children aged 12-15 back on 4 June (link), after concluding that the benefits exceed any risks. Vaccination programmes are now underway for these age groups for various countries, including the US, Canada and Germany.
However, it is believed that the Joint Committee on Vaccination and Immunisation (JCVI) will not recommend that this age group be included in the UK vaccination programme (link). As the risk of serious illness from COVID-19 is very low for children, there is continuing debate on the efficacy and appropriateness of vaccinating children when there are still many vulnerable groups in the UK and around the world who are yet to receive any vaccination.
The public health benefits of vaccination to prevent transmission are lower for this age group as the risk of transmission is significantly lower than for older children and adults. In addition, the Centres for Disease Control and Prevention (CDC) have identified 393 cases of inflammation of the heart, either myocarditis or pericarditis, for those under age 30 receiving the Pfizer/BioNTech or Moderna vaccines; this represents a rate of 12.6 cases per million vaccinations (link). Various vaccine experts are recommending that further investigation of possible side-effects is merited before a decision is taken on extending the vaccination programme.
Take-up Rates
We can see from the charts below that the vaccination programme is coming to the end of the first dose exercise for all those who have taken-up the offer. Below age 30, Wales now appears to be “mopping-up” any last remaining cases, although the other countries are maybe around 10 days behind at current rate of progress.
One subject of debate regarding take-up has been the denominator used, with ONS estimates criticised for being too low in the 75-79 age range, resulting in an absurd result of 103%. On Friday the ONS published its annual update of population estimates, and as a result the take-up rate in that age group has now fallen to the slightly more plausible 99.6%.
We can clearly see the reduction in take-up particularly below 50, but it looks as though we are likely to achieve around 75% for 30-39 and just over 70% under 30.

Clinical and medical news
Changing patterns of symptoms from ZOE COVID app (link)
Since the beginning of the COVID-19 pandemic, the ZOE COVID study app has been recording and tracking symptoms from millions of users, providing highly valuable real-time estimates of the spread of the virus.
Earlier this week, Professor Tim Spector revealed that analysis of recent responses indicated that the most frequently declared symptoms were different depending on vaccination status. The top five symptoms declared were as follows:
| Ranking of symptoms | Fully vaccinated | Partially vaccinated | Unvaccinated |
| Most frequent | Headache | Headache | Headache |
| 2nd | Runny nose | Runny nose | Sore throat |
| 3rd | Sneezing | Sore throat | Runny nose |
| 4th | Sore throat | Sneezing | Fever |
| 5th | Other | Persistent cough | Persistent cough |
It is clear that the constellation of symptoms not only differs according to vaccination status, but is very different to the symptoms first associated with the virus more than a year ago, and reflect changes in the variants. The trademark symptoms of persistent cough, loss of smell, shortness of breath and fever now rank at 8, 11, 29 and 12 for those who have been fully vaccinated. Unexplained frequent sneezing is a particularly strong sign that a fully vaccinated individual may have COVID-19, and tests and self-isolation are recommended to protect others.
Monoclonal antibody benefits those without immune response (link)
The latest of the RECOVERY trials published on 16 June show the benefits of a combination of two monoclonal antibodies (casirivimab and imdevimab) developed by Regeneron against standard usual care for COVID-19 patients in hospital. This study involved 9,785 patients, one-third of whom had not developed an immune response to the virus despite being infected. This would include immunocompromised patients such as those who were receiving cancer treatment or organ transplants. The group that received the combination therapy (also known as REGEN-COV) and were sero-negative experienced 20% lower 28-day mortality (24% vs 30%) as compared to the usual care group, or 6 fewer deaths per 100 patients. In addition, the duration of hospital stay was 4 days shorter (13 days vs 17 days), and the likelihood of requiring mechanical ventilation was lower. No benefits were seen with the combination treatment for either those who were seropositive or whose antibody status was unknown.
This trial follows on from previous studies that have shown clinical benefits for non-hospitalised COVID-19 patients. However, it is the first to have demonstrated benefits from any anti-viral treatment in hospitalised COVID-19 patients, and as such is a step forward in the treatment of advanced COVID-19 disease.
It has been widely noted that REGEN-COV is an expensive treatment. Eli Lilly has a contract of $450m with the US government to provide up to 300,000 doses of REGEN-COV, suggesting a unit cost of $1,500. The effective unit cost will be higher if fewer doses are used, but the overall cost is being met by the US government rather than individual patients or their insurers. At this lower level, the effective cost per life saved of the drug alone would be of the order of £20,000.
This does not consider the additional costs associated with hospital treatment and the potential reduction in the number of days care required. By way of comparison, the cost of treating a patient with the corticosteroid, dexamethasone is of the order of £5 per patient, but a UK study estimated the overall value per life saved of treating patients with dexamethasone was £8,200 (link).
Risk factors of Long COVID identified in CONVALESCENCE study (link)
Pre-print results from the CONVALESCENCE study, funded by the UKRI-NIHR, have quantified sociodemographic and health risk factors associated with long COVID as part of the UK National Core Study for Longitudinal Health and Wellbeing. The studies tracked 6,899 individuals who had self-reported COVID-19 infections from UK longitudinal samples (out of 45,096 population) and 3,327 cases that were assigned a long COVID-19 code on electronic health records (out of 1.2 m population).
The percentage of those reporting limiting long COVID for 12+ weeks increased linearly with age between ages 20 to 70, being 1.2% at age 20 as compared to 4.8% at age 63.
The table below highlights those risk factors associated with symptoms of long COVID lasting 4+ weeks from these two sources, and illustrates both the expected risk multiplier and the level of uncertainty denoted by the confidence intervals.

Modelling
In our recent paper “Modelling the Return of Freedoms” (link) we noted that it will be important to monitor various aspects of the outbreak, to determine which outcome of those illustrated by the modellers is most likely to be seen in practice. We set out below our summary of some of the key metrics relating to cases, hospitalisations and deaths in the UK.
- Rate of growth of cases
- As noted elsewhere in this Report, the estimated reproduction rate in the UK is around 1.3, implying a daily increase in cases of around 3% to 5%.
- There were 90,511 positive cases of COVID-19 reported in the 7 days up to 25 June 2021, a week on week increase of 29,330 cases or 48% (link).
- The proportion of sequences in the UK that are the Delta variant has reached 90% – the chart below is from GISAID (Global Initiative on Sharing Avian Influenza Data) (link).

This is consistent with a transmission advantage of delta over alpha of 50% to 100%, within the range of assumptions used by the modellers. It should be possible to narrow this range further over July.
- Hospitalisation counts
In the week to 20 June 2021, hospitalisation rates in England increased to 1.86 per 100,000 – a weekly average of around 180 admissions per day. As noted by PHE, this reflects a doubling in the rate seen three weeks previous but significantly lower than the peak in mid-January, at 36 per 100,000.
- Average age of hospitalisations
Given the proportions vaccinated at the oldest ages, if the vaccines are effective against hospitalisation, we would expect the average age of COVID-19 hospitalisations to have decreased over time. Vaccines are expected to be similarly effective against hospitalisations for the Delta variant compared to the Alpha variant although this is not yet certain. If effectiveness was less good against Delta, we might expect the average age to increase again.
Whilst the exact average age of hospitalisations is unknown (reporting is by age bands, not individual age) it has certainly dropped significantly over time and is likely now below 50, having been around 70 through the early part of the pandemic (link to data). An alternative way of looking at this: the proportion of hospitalisations who are over age 75 is now 20%, having previously been at 50%.
- Hospitalisations by vaccine status
Daily publications do not typically include the vaccination status of hospitalisations so it is necessary to rely on slightly less up to date data.
Public Health England estimate that the vaccines are around 93% effective after two doses against hospitalisation for Alpha, and around 96% for Delta.
A recent detailed analysis is set out here (link), setting out the methodology used, although the figures quoted are PHE’s most recent estimate with more data, which supersedes the figures in the analysis.
As noted in our paper on the models, this level of effectiveness against hospitalisation is somewhat higher than assumed by some of the models – a high level of effectiveness against hospitalisation is a very positive sign that the NHS is unlikely to be overwhelmed by the exit wave of cases.
- Admissions per case
PHE also sets out the number of admissions and the number of cases included in their analysis. There were 288 admissions, out of a total of 27,211 cases analysed. This means that around 1% of cases resulted in an admission. It’s also clear from the PHE paper that the majority of the cases analysed were in younger people who had a lower likelihood of admission.
Data
Long COVID REACT study (link)
As well as the CONVALESCENCE study discussed earlier, Imperial College’s REACT study has also been monitoring Long COVID (“LC”) cases and published its report this week. Based on over half a million responses to their regular infection surveillance between September and February, it estimated that around two million people may be affected by LC.
Of the 19% who registered a positive test at the time, a follow up recorded that 38% had at least one symptom of LC lasting more than 12 weeks, and 15% had three or more symptoms. A third of the 38% said that their symptoms were at a level to have an impact on their daily living.
The symptoms can broadly be categorised as either fatigue related, or respiratory. Those who had multiple symptoms during the original infection were more likely to suffer LC symptoms, although even some who displayed fewer symptoms initially also reported having LC.

A surprising finding given the relative mortality, is that females are much more likely (+50%) to have LC than males. Less surprising is the positive correlation between age and also smoking status with the risk of LC.
We wrote (link) on the subject this week, with more details and references on the condition.
Variant Surveillance
WHO Nomenclature
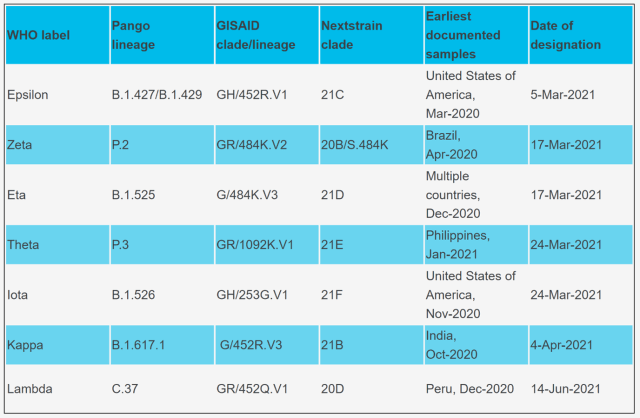
As noted in our last bulletin, the World Health Organisation has published its new Greek alphabet naming convention for variants (link) and their latest version of the table is reproduced below.
Variants of concern

Variants of Interest
Public Health England surveillance
Delta case statistics
Public Health England (PHE) publishes weekly statistics on numbers of cases by variant type (link). In the most recent week which compares cumulative cases to 23 June (vs 16 June) we see:
- Delta: 35,204 new cases
- Alpha: 2,399 new cases
- 20 or fewer cases were found for each of the other variants monitored.
There has been attention in the press regarding a Delta variant with an additional mutation in the K417N gene, labelled as AY.1 by PHE and nicknamed “Delta plus”. To date only 42 cases have been identified in the UK. Given low case numbers, it is unclear whether this mutation results in extra advantage over ‘normal’ Delta (link)
PHE also produces a detailed weekly technical briefings on variants (link). The latest report notes that for cases with specimen dates in early June, over 85% of cases were either sequenced or genotyped to give an indication of variant type but operational issues in recent weeks have reduced this figure. They note that the Delta variant accounted for 95% of sequenced cases (i.e. variant confirmed) and 92% of genotyped cases (i.e. variant probable) for specimen dates 7 to 21 June.
Delta variant transmissibility, immune escape and severity
The PHE technical briefing sets out statistics covering multiple aspects of the Delta variant and compares these to other variants, and in particular Alpha where case numbers are also material.
Delta’s increased prevalence in recent weeks is connected to its greater transmissibility and the report shows that secondary attack rates among close contacts of non-travellers are higher for Delta than for Alpha variant cases: 10.7% (95% CI 10.5% to 10.9%) vs 7.9% (95% CI 7.7% to 8.0%) over 29 March to 1 June 2021 i.e. Delta vs Alpha secondary attack rate is 35% higher when comparing point estimates. When splitting the data into household vs non-household contacts, Delta cases from non-household contacts made up a higher proportion of total cases identified and in non-household settings, secondary attack rates are lower. When comparing like-for-like contact settings, Delta vs Alpha secondary attack rates are around 40% higher.
There has been a slight increase since last week’s report in the estimate of first dose effectiveness against symptomatic disease, but it is still only 35%. Against two doses it stays around 80% but that is still twice the level of escape reported for Alpha. However, vaccine effectiveness against hospitalisation of 96% appears to be broadly similar between the variants.


The relative risk of hospitalisation is higher for Delta, however, with recent U
K studies ranging from +80% to +120%.
Information on hospitalisation by variant type shows that:
- Cumulative inpatient admissions are higher for under 50s with the Delta variant while the reverse is true for the Alpha variant. This likely relates to the progression of vaccine roll-out among over 50s and the absence of Delta earlier in the vaccine roll-out.
- Delta case fatality rates are lower than those for Alpha and are influenced by the shorter follow-up to time of death from the time cases first started presenting, compared with Alpha.

Given the prevalence of the Delta variant, the PHE report goes on to give more detailed analysis on this variant. 10% of Delta variant cases are among those aged 50 plus while 32% of inpatient admissions and 93% of deaths are in this age group.
Of the 109 deaths among those over the age of 50:
- 38 were unvaccinated
- 8 had received one dose
- 50 had received 2 doses
According to data for England from the Coronavirus Government Dashboard (link) around 10% of over 50s on the vaccine register have yet to receive a first vaccination, a position that has changed little since May. However, 35% of deaths are among the unvaccinated which points to the effectiveness of vaccines at preventing severe outcomes. The proportion of deaths may seem high among the fully vaccinated. But no vaccine is 100% effective and the risk factors for deaths are many times higher in the fully vaccinated group because of the priority ordering applied for vaccination.
Further studies on Delta variant emergence (link)
A pre-print study by Gupta et al from the Cambridge Institute of Therapeutic Immunology & Infectious Disease looked at the apparent growth advantage of the Delta variant compared with the Alpha variant. They combined modelling at population level, molecular epidemiology and in vitro experimentation to propose that a combination of increases in replication fitness and reduced sensitivity to neutralising antibodies from past infection contributed to the devastating epidemic wave in India during the first quarter of 2021.
The study analysed the growth and dominance of the Delta variant in Mumbai and concluded, subject to various reporting uncertainties, that the Delta variant is 1.1 to 1.4-fold more transmissible than previously circulating variants in Mumbai and that the Delta variant is able to evade 20% to 55% of immune protection provided by prior infection with other variants.
The study also considered immune evasion among mostly fully 2-dose vaccinated health care workers in Delhi hospitals. The vaccine used was Covishield which is the locally produced version of AZ. Symptomatic COVID was confirmed in 30 vaccinated staff members, of which one required oxygen therapy but no mechanical ventilation, out of a total workforce of 3,800 workers at one site, many of the cases arising from a single super-spreading event. The study found a higher viral load in Delta vs non-Delta variant infections with a median Ct (cycle threshold) value of 16.5 vs 19 for Delta vs non-Delta infections among health care workers.
In vitro studies using a limited number of UK samples showed that the Delta variant is less sensitive to neutralising antibodies from recovered and vaccinated individuals.
ONS Antibody data (link)
The latest antibody survey shows that levels across the UK have continued to rise, with 87% in England, similar levels in Northern Ireland and Wales, but Scotland continuing to be slightly lower at 79%.
The age distribution (below) is as might be expected, with older ages much higher due to the timing of the vaccination programme. Younger ages are lower, but higher than vaccination numbers would alone imply due to naturally acquired infections.
 Note the apparent waning in the oldest ages (highlighted), who have received their second dose earliest. The underlying data confirms that this is indeed a reduction over time, as opposed to those ages not having attained as high a level as younger ages. We saw this effect after the first dose too, with reductions appearing shortly before the second dose was administered.
The presence of antibodies (and at a level detectable by the test) is only one measure of immunity. Nevertheless, the appearance of some waning relatively soon after a second dose will be relevant in assessing the benefits and timing of a booster dose this autumn.
ONS Infection Survey (link)
The latest weekly update from the ONS shows a dramatic jump in the infection prevalence in Scotland, which at 0.46% has nearly tripled in one week, to more than twice that anywhere else in the UK.
Elsewhere we see a steady but lower increase in England to 0.22%; Wales (0.12%), volatile due to less data, appears to be trending upwards quickly, albeit from a much lower base. Finally, Northern Ireland (0.14%) appears more stable, following a jump up around a month ago.
“R” Estimate (link)
SAGE’s estimate of R for England is unchanged for the second week, remaining at a range of 1.2 to 1.4. Regionally, the South West is now the highest, and its upper limit of 1.7 is higher than anything we have seen since these estimates were started over a year ago. If it were to be at that level then it would imply a doubling every 6 to 7 days.
25 June 2021