
On 1st January, we published our first short blog on the proposed DB Funding Code:
In that commentary, we raised several issues of principle with state directed investment, as well as issues over the magnitude of the risk for which the Code and Regulations are seen as a remedy. We touched only briefly on the question of concentration in investment strategies and holdings, which of course is a potential source of catastrophic risk, as we saw in the LDI crisis, resulting in significant intervention by the Bank of England.
Investment strategies which are essentially backstopped by government agency interventions for their effectiveness are simply intolerable if we are to have free, fair, and efficient financial markets. It was fortuitous for us, as taxpayers, that this intervention was, in isolation profitable, to the tune of £3.8 billion; many other interventions would not be. The cost to the taxpayer of the tax relief on additional deficit make up contributions by employers as a result of LDI and leveraged LDI remains to be seen.
A question, prompted by that blog, was raised concerning the costs of the LDI driven gilt turmoil. Our response still applies: “We will probably never know the true cost of LDI even in terms just of UK schemes. We will only gradually be able to see the true declines in scheme assets as they report over the next three years. We may get an indication from the next The Financial Survey of Pension Schemes (FSPS) report from the ONS but that is not due until March – but that is survey based and, in some regards, still experimental.”
There is also the separate cost of rolling over short borrowings via repos used to lock into to long dated fixed interest and index linked gilts which will take some time to feed through. With some £200 billion of repo outstanding the increase in rates from 0.5% to 4%, will, if maintained, be adding £7 billion annually to scheme costs. If not maintained, the loss on the gilts held in repo will be realised, and that might be as much as 70% in the case of long-dated index linked gilts.
We would also note that some schemes have been valuing private investments at higher prices than their year-end 2021 values, while everything else has shown declines. Secondary market price quotations for private equity have been 15% – 20% lower than those year-end prices. This alone may confound loss estimates. With the decline in bond prices, private investments are now a larger share of scheme allocation than intended and it appears that some will now need be sold in the process of rebalancing portfolios.
The over 15-year conventional gilt index fell by 40.05% and the over 15-year index linked gilt index fell by 46.92% over that year (2022). Among the few schemes so far publicly reporting, we have seen assets decline by as much as 30% or 40%. The PPF’s estimate of a decline of only 22.5%, when the present value of liabilities declined by 38.8% looks extremely optimistic. This would imply that schemes overall were less than 50% hedged, far below the estimates offered by multi-scheme administrators and managers. So far, we have seen only USS offer a decline in asset values of this magnitude circa £20bn, but they are making claims of strong performance from private investments and so asset values have declined from a high of over £90bn at the end of 2021 to a reported figure of £72bn in late 2022.[1]
There is a discrepancy between the ONS June 2022 asset values and those calculated by the PPF using their algorithm. The ONS survey returns net assets of £1,458 billion while the PPF reports assets of £1,599 billion, a difference of £141 billion. Earlier discrepancies are small of the order of £10 – £20 billion. In fairness, the PPF regularly cautions readers as to the reliability of their estimates in precisely the circumstances we have seen this year: “We do not hold sufficient data to capture the impact of any structural changes to asset allocations nor to accurately capture changes in any leveraged LDI portfolios.”
One thing though is clear, the decline is asset values this year carries with it a tax cost, a very substantial cost. As schemes recover their previous asset values through investment returns and further contributions, these will be tax-advantaged, for the second time. And that cost is of the order of £100 billion lost to the Exchequer.

The Performance of LDI
Many, such as the 100 Group, have claimed that LDI produced strong returns over the period to the end of 2021. None have offered any evidence to support this assertion. However, we may examine this proposition. We consider the period from the end of 2009, which was the point at which trustees might have decided to take advantage of the significant spread between six-month and twenty-year gilt rates, until the end of 2021. From Figure 1 below, it is evident from the derivatives exposures of DB schemes that from 2009 LDI take-up by schemes became widespread.
Figure 1: Positive and Negative Derivatives Values of DB Schemes

Source: ONS MQ5
The timing of the increase in derivatives usage indicates that the motivation for leveraged LDI was less the hedging of so-called interest rate exposures and rather more the desire to generate excess returns from non-gilt assets using borrowed funds. Simply put, that is speculation and not investment.
It is also interesting that at the time of the mis-transposition of the IORP Derivative, 2005, the use of derivatives was extremely small, just 4.3% of assets and 1.8% of liabilities.
Schemes had some £1,114 billion of assets in 2009[i], and over the period to end 2021, sponsors have made additional deficit repair contributions of £200 billion, with the result that net assets at the end of 2021 were £1,820 billion. This is a compound rate of return lying in the range 2.5% pa to 3% pa.
Schemes have paid pensions of between £43 billion and £53 billion annually in this this period. Pensions paid as a proportion of scheme assets have declined from 3.9% in 2009 to 2.7% in 2021, and average 3.2% over the period.
This suggests that overall scheme returns have been in the range 5.7% pa and 6.2% pa. This does not support the assertion of excess performance, as is evident from the obvious counterfactual – a buy and hold gilt strategy. A twenty-year gilt zero bought in 2009 and sold with 8 years remaining life, at the prevailing 0.72% gilt yield at the end of 2021 would have returned a compound 7.2% pa.
Similarly, claims are made that the funding ratio of schemes has improved because of LDI. Such an improvement may have two possible sources with respect to assets. They may have been higher at the end of 2021 than might otherwise have been the case, but the previous paragraphs demonstrate that this is unlikely. The second would be asset outperformance in 2022.
Here we may call upon the reported experience of Dutch schemes as an indicator. These schemes utilised far lower levels of hedging than evident in the UK. Table 1 shows the overall reported returns of six large Dutch schemes along with their reported returns net of hedging costs. Dutch schemes, if fully hedged, would have lost between 30% and 40% of their asset values depending on the scheme specifics. The actual (compound) costs of hedging indicate that hedging levels ranged from around 15% to 50%. It is also evident that higher returns are associated with lower levels of hedging or LDI. In other words, the improvements seen in the funding ratio are the result of the extent to which schemes did not use LDI, and certainly did not arise because of it.
Table 1: Dutch Scheme Performance 2022

The Funding Code
The proposed DB Funding Code continues TPR’s agenda of encouraging LDI, but it completely ignores the infeasibility of hedging the entire market with conventional gilts, and indeed the concentration risk if all gilts were to be used. If we have today scheme liabilities of around £1 trillion with a modified duration of 15 years, then the entire stock of conventional gilts, which have a market value of £1,259 billion and a modified duration of 9.52 years[2], this would be sufficient to cover only 80% of the schemes’ risk exposure. If both conventional and index linked gilts were used to hedge the total DB exposure, this would consume 64% of the outstanding stock.
Of course, schemes overall will not have reached significant maturity, the point at which they would be required to hold low-dependence portfolios, where that point is defined as a modified duration of 12 years, for some period; it is 13 years from now with gilt yields at 4%. We show below, Figure 2, the projected pension payments together with the redemption values of conventional and index-linked gilts.
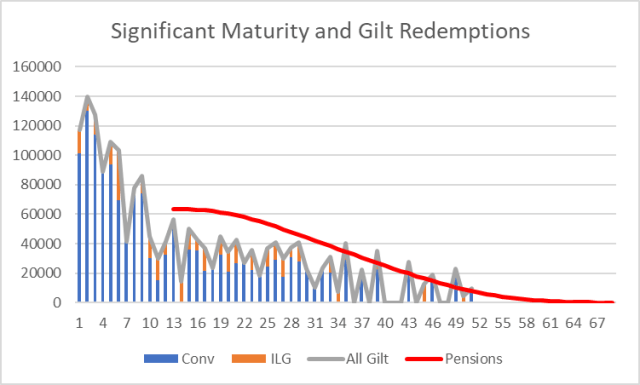 Figure 2: Gilt Redemptions and Projected Pension Payments post ‘Significant Maturity’
There are in fact only a handful of years in which redemptions of gilts are sufficient to fully discharge that year’s pension payments. Redemptions of currently issued stock account for only 58% of projected pension payments. The total undiscounted shortfall is some £660 billion. It is notable that the Bank of England owns just £306 billion of gilts maturing in this period (out of its QE stock of £830 billion) and these are counted in the outstanding stock figures shown. Of course, in addition to redemptions, coupon payments on the outstanding stock would go far in meeting pension payments, but an average coupon rate of 5.1% on all outstanding gilt stock would be needed to fully discharge them.
While it is possible, likely even, that we may see government borrowing of £150 -£200 billion annually for the next four or five years, it is clear that even with this, a concentration problem is likely to develop. With that of course, comes additional market price volatility.
Concentration risk of the magnitude we are talking about is not the conventional conceptualisation of concentration risk that people think of at a micro/scheme level i.e., holding too much of a particular investment. We are talking about at a macro-level where concentration is so large that it reduces the free float of tradable securities, but where that concentration cannot be sold as a positive and commands a price premium. Where that concentration may be sold, as we saw in the crisis, it requires securities to be sold at discounts to their otherwise fair value. It is clear that index linked gilts moved from premium pricing to trading at a discount in the course of the market turmoil.
Funding Ratio
The funding ratio is the most commonly used and cited measure of the financial health or sufficiency of the scheme. It is being widely cited, by among others, the 100 group, as having improved markedly this year.
It is simply the ratio of the value of the scheme’s assets to the present value of scheme liabilities. As we have not seen the theoretical statistical properties of this ratio described elsewhere, we provide those in Box 1.

The funding ratio is often presented as if it is a settled and certain fact, when it should in fact be treated as the estimate it is, and good practice would require its confidence intervals to be shown alongside its estimated value.
Under normal market volatility conditions, for a fully funded scheme, the one standard deviation confidence interval ranges from 96.2% to 104.1%. Under the market conditions seen recently, that confidence interval has expanded to 89.1% – 112.6%. These values have been estimated by simulation from empirical data on intraday prices and yields. There are very few, if any, schemes employing LDI with improvements large enough to qualify as statistically significant; there are many not employing LDI where the improvements are statistically significant.
The proposed Funding Code sets a stress limit of 4.5% on the funding ratio. Given the statistical properties of the ratio and of market prices and yields, this is simply nonsensical.
The most elementary analysis of the crisis tells us that schemes now have far fewer assets than at the beginning of the year. Simply put, schemes currently own fewer assets by value from which they will have to pay pension obligations which are basically unchanged, as interest rates are not a determinant of the ultimate pension liability payable.
Common sense tells us that a greater reliance on uncertain future returns is riskier but the modified duration, which will have fallen with a rising interest rates, suggests that the assets and liabilities have a shorter modified duration and are less volatile or risky.
It is also far from certain that the expected returns from assets held will warrant the use of the higher gilt yields as the scheme discount rate, given the various sales and other actions taken to meet collateral calls. In distress, these sales included the high growth, high return assets, of schemes, and this was done without any true regard for their return prospects.
It is one of many paradoxes of the Pensions Regulator’s behaviour that they should be lauding the improvement in the funding ratio, when that arises from the increase in discount rates as with that the reliance on the sponsor increases. The sponsor is liable for any shortfalls in investment returns below the discount rate being utilised in the valuation, and with the shift in rates this year from 1.22% to 4%, the exposure to the sponsor employer has increased in both likelihood and in magnitude.
Another of the incongruities of the proposed Code is the Pensions Regulator’s encouragement of the use of corporate bonds in low-dependence portfolios. It is precisely the possibility of distress and default of the sponsor which motivates the Regulations and Code and supports their arguments for overfunding of schemes. Allowing corporate bonds to be used reintroduces these risks into the system and where corporate bond issuance by sponsor companies is greater than their scheme deficits, can magnify them in the DB pension system as a whole. It is particularly troubling given that the UK corporate insolvency rate has shown explosive growth in the post=pandemic period.
Over the coming weeks, we will be writing a series of blogs analysing the proposed Regulations and Code and responding to the 54 questions posed in the DB Funding Code consultation. We are sure that the prospect of that is an enticing one for all.

The authors
[1] Monitoring of the 2020 Financial Management Plan September 2022.
[2] Source: UK Debt Management Office
[i] ONS MQ5 market value of scheme assets
Terrific introductory article. Vital reading for anyone genuinely interested in sustainable long term pension investment. Not good reading for those concerned only with the short term electoral or bonus cycles. Everyone can see the UK is suffering from chronic under-investment across the board, especially on critical infrastructure (HS2 does not count – it’s “spades in the ground” for the sake of it) and innovation at all levels. But investment is difficult and requires judgement, skill and faith, and a longer term perspective. Speculation is the lazy-man’s way out – just a way of “being in the market”, but without any considered assessment to properly direct activity or to manage real risks, and of course it’s especially attractive when it’s with someone else’s money that you can graft an annual share from.
And everything about the pension funding code is embedding this whole complacent malaise. Back to basics – stop short term mark to market valuations and the use of spot rates for discounting long term liabilities, and only allow the tax favoured regime (both for contributions and investments) in productive assets. It just does not make sense to be providing up-front tax relief for pension contributions that are in effect used to buy govt debt – if anyone else had to provide you with an immediate 25% rebate to purchase a long term asset you’d seriously question the long term recoverability of that asset…?
“An investment operation is one which, on thorough analysis, promises safety of principal and a satisfactory return. Operations not meeting these requirements are speculative.”
Ben Graham
The title “Investment or speculation” arguably needs to be extended to include the words “insurance or protection”. The latter covers why most LDI was, and will be, taken out. To add to the debate, predictions please on the likely or necessary interest rate and inflation risks being underwritten by DB scheme sponsors over the next 12-36 months. (Noting what a waste of money that house insurance was last year, the house didn’t burn down etc.) Re. TPR Code, why not solve your new mortgage cost by borrowing three times as much and investing 2/3rds in equities at an assumed return of +3%, halve your monthly repayment or pay off in 12 years!
Borrowing to “invest”, Allan?
Is that borrowing by DB trustees even allowed under the 2005 Investment Regs as re-interpreted by Baroness Bowles for the W&PSC in her written evidence?
I’m also confused, as you also seem to be confusing, about considering the next 12-36 months and/or the next 12 years. You seem too attached to short-term annual and triennial reporting by actuaries? What is your longer-term plan for safety of principal at a diversified portfolio level with satisfactory returns with which to pay pensions as they fall due?
I know this is a daily blog, but the above chart on gilt maturities has been turning over in my head overnight. This is just back-door (turbo) SERPs and its irresponsible and not sustainable.
A funding regime that coerces a shift of the responsibility for the payment of £2trn of private sector pensions from the general global economy (equities) over to the State (gilts under the guise of LDI) is just absolute folly.
ok, perhaps could be seen as being good business for Govt when it was taking on these turbo-SERPs liabilities for 0.5% yields (or even negative yields – the “moron premium”), but (as was the case in abandoning SERPs) it’s not sustainable when its a whole system transition, and it gets unaffordable when the yield is above 4%. And, conversely, it was terrible business for any schemes that got sucked / advised into buying gilts at such awful rates.
All that’s before we even consider the systemic risk from such a herd funding approach, or the economic drag on the system from the demise of schemes not providing capital for innovation and investment.
Myopic funding regulations (“gilts at any cost”) need to come under proper ministerial oversight with some long term economic impact-assessment, and taken out with the electoral and bonus cycles.